
Why the Revamp?
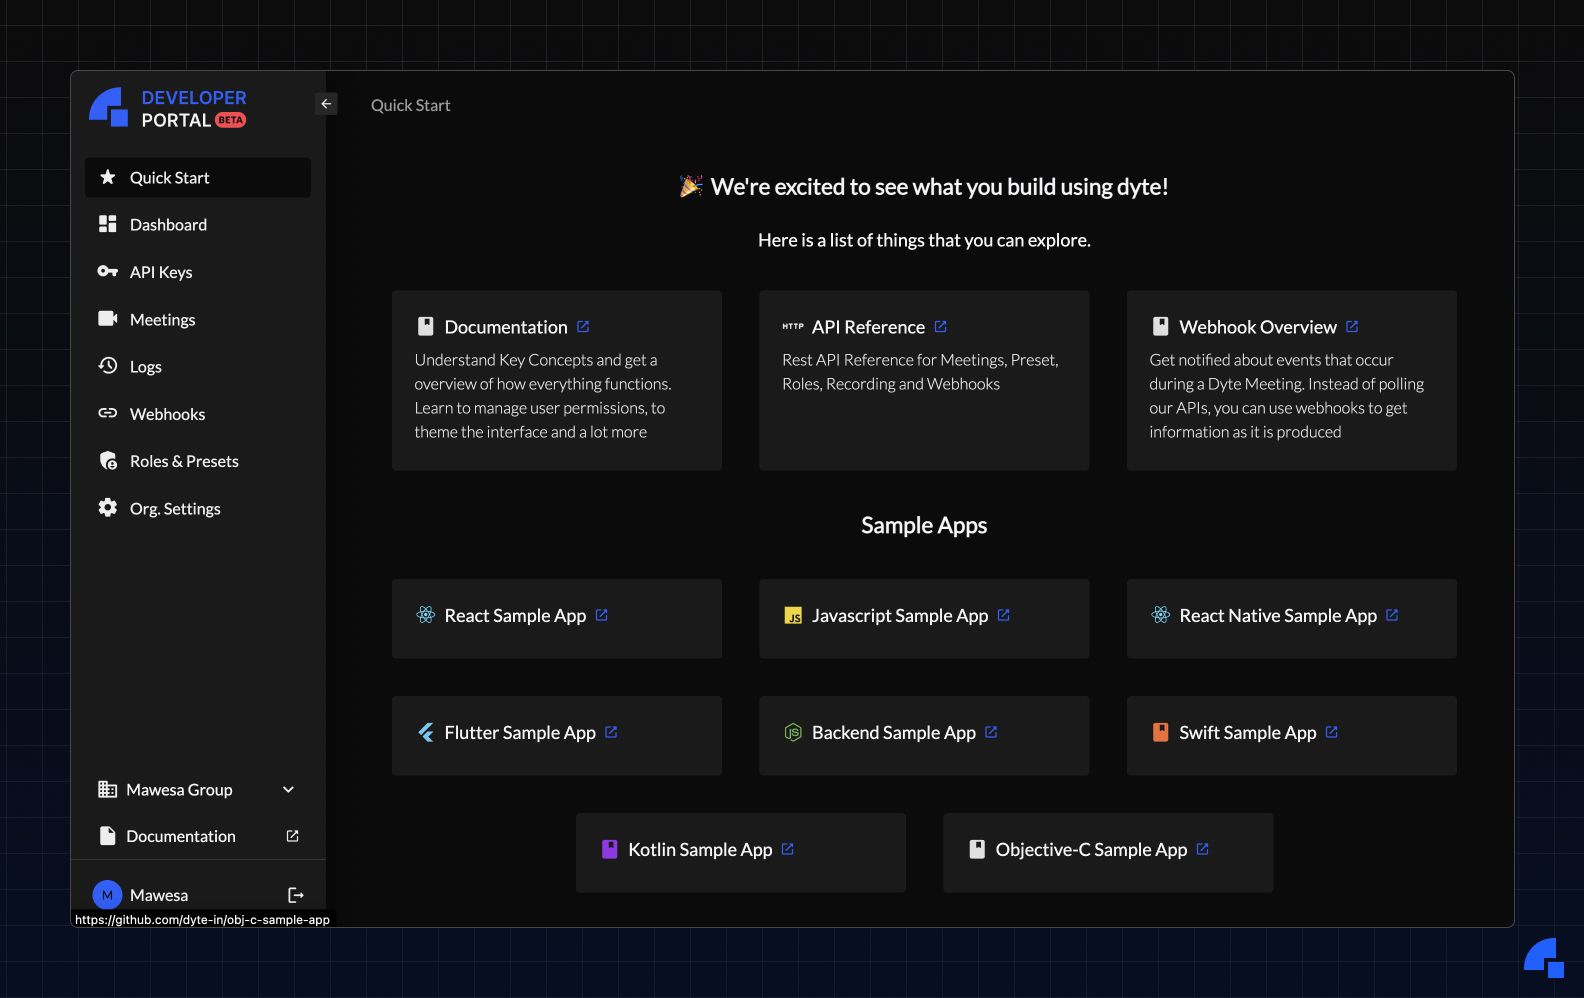
At Dyte we try to provide the most seamless experience for implementing our video SDK, but we understand every real-time application needs monitoring and metrics to provide quality of service. The new developer portal revamp will allow developers to track call statistics for meetings and individual users to give insights into any issues with client-side performance or delivery. These changes will be the beginning of a large suite of tools available to track and manage quality of service in any Dyte-powered video platform.
WebRTC Stats Collection
We use several bleeding-edge WebRTC APIs to collect stats about audio, video, and network performance. A few of the key data points we use reside in the inbound and outbound RTP streams. These both give us the performance and network information such as picture loss or audio concealment events to name a few. The internal workings of video and audio codec performance or network efficiency are all important to pull in and take into consideration.
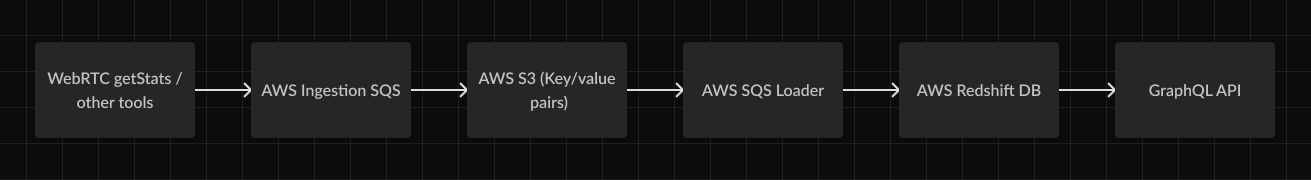
A general idea of the process we use to build a collection of WebRTC stats is as follows:
- Using the WebRTC getStats calls on the browser gives us a map of several important performance metrics.
- These metrics are then sent to our backend and stored in a relational database.
- A GraphQL API interprets the data and returns the quality of the data streams.
- This analysis and interpretation are rendered on the new Dyte developer portal in human-readable graphs and tables.
Using GraphQL has allowed us to take advantage of a large set of data while retaining performance on reading and analysing that data. With a combination of query introspection and SQL query optimization we are able to return subsets of large chunks of performance metrics. This allows us to perform multiple operations on the data to determine a quality metric while retaining quick load times.
Collation and Interpretation
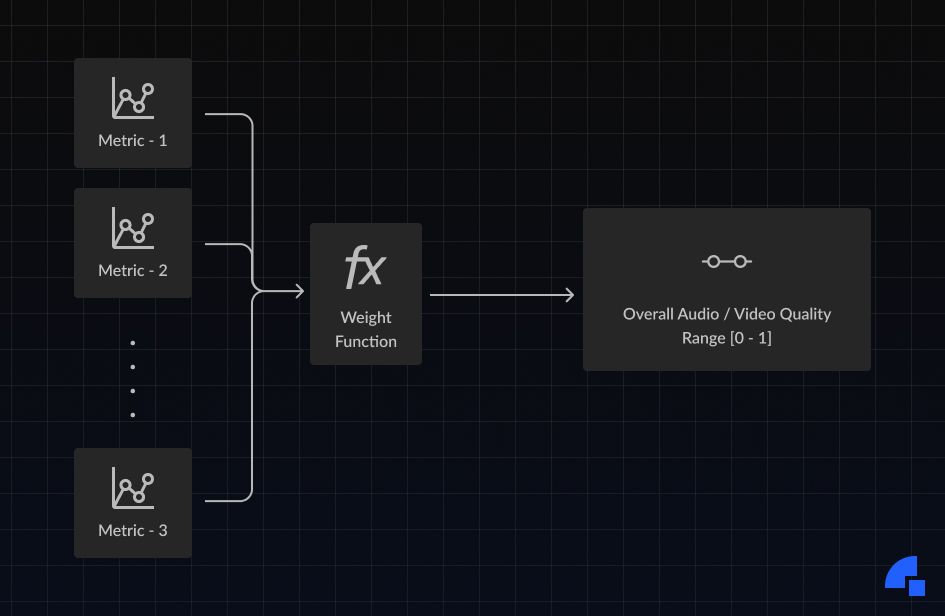
Our statistics API uses a proprietary model for determining the overall quality of the audio and video streams of an individual user during a meeting. To give an idea of how this model functions we take the following, but not limited to, properties into consideration:
All of these metrics play a small, but non-negligible role in determining the overall quality of a video or audio stream. Some of these metrics can be codec or stream type specific, which our SDK takes into account. This allows you as a developer to look past all the small technical details and get to what actually matters; did the customer have a good or bad experience? At Dyte we want to make sure you have all the tools and information you need to see the bigger picture, but also dive into the nitty-gritty if necessary.
if ideal <= 0:
    # Set ideal to very low number to avoid dividing by zero
    ideal = 0.0001
    quality = ideal / max(stat, ideal) * weight
else:
    quality = min(stat, ideal) / ideal * weight
Generalized quality determination.
Our API uses a set of pre-defined weights to determine which metrics are the most important in a user experience based on internal automated tests and data we can compare it to. This ensures an accurate estimation of the quality determined by our API so that developers don’t have to see or hear the call themselves to know what a customer experienced. Rapid and efficient analysis of issues in production is an important part of this release, usage of these new changes will help do so.
Network and Client Performance
Two important parts of determining performance include how the video is encoded on the client side and sent out/received over the network. To calculate these metrics we separate them into two use cases; quality limitation reasons and pre-call network stats.
Quality Limitation Reasons
Quality limitation reasons cover the client-side performance aspect of encoding and delivering the video stream. You can read more on the native metric on the Mozilla MDN site.
We use this metric to return a percentage of time the video stream was throttle by either the client’s hardware (CPU) or their network (bandwidth). Integrating this into the overall call quality can give an indication as to what is causing a user problems with quality of service, so that developers can optimize for specific bottlenecks.
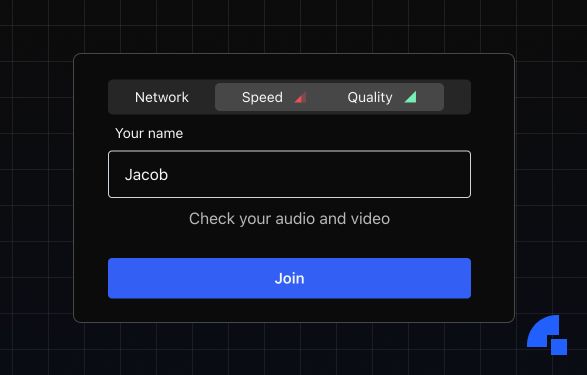
Pre-call Network Stats
To determine network connectivity in a glance, our API takes a snapshot of important networking stats to the Dyte media servers. Pre-call network stats are a combination of TURN connectivity, jitter, packet loss, network type, and throughput, among a few others. The combination of these factors gives us a good idea of what a user may experience during the call before it starts, we can use this information to generate warnings or alerts.
In future releases we plan to use these stats to facilitate the developer side, comparing the predicted pre-call stats with the actual stats during the call. The data pulled from these stages of the call will give deep insight into the why of what went wrong in the call and not just that it did go wrong.
Presentation
So how does this data get wrapped up into a meaningful visualization? In the current release, a graph displaying the audio and video quality over time can be seen on the participant section of the session logs page.
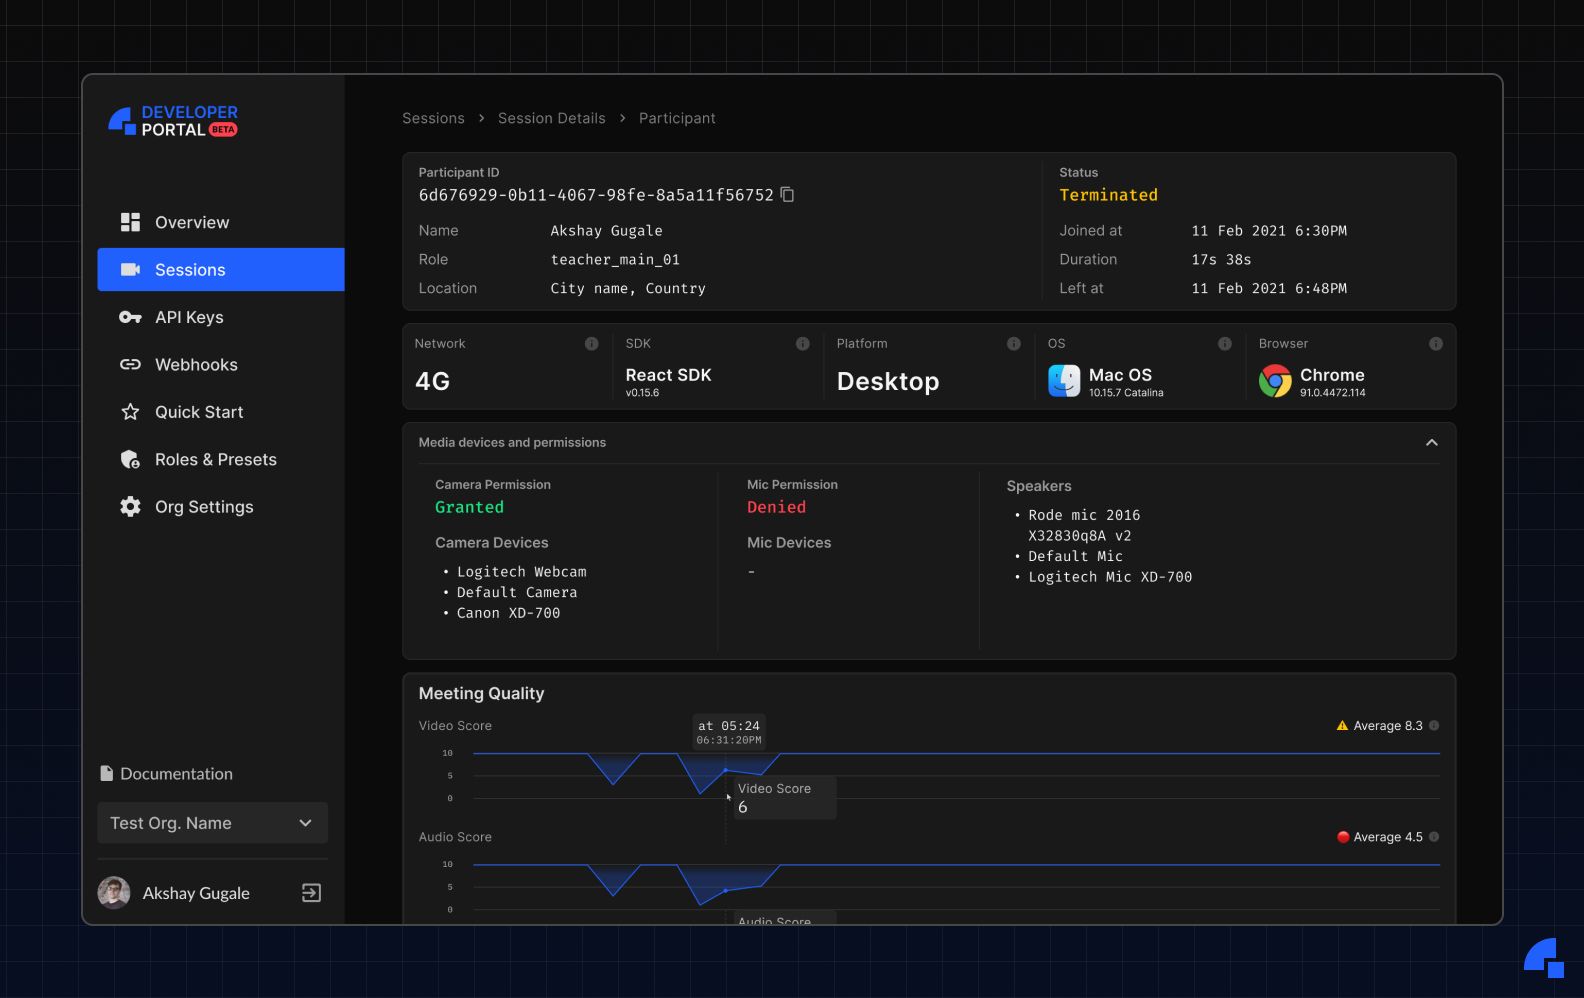
Overall quality for this participant had no issue other than during a small ramp-up period when they first joined the call. If this user experienced a packet loss or some other throttle, it would show as a dip in the call quality timeline in this diagram.
Dips in this graph are the main thing to pay attention to, as they usually mean a quality of service issue such as a drop in the packets or frame rate. Future releases will include insights that will automatically let developers know what may have gone wrong and what can be done to fix it. Alerts for sessions and participants will be pushed as they appear in real-time.
Wrapping Up
The new developer portal revamp should definitely be on your radar if you plan to or already have implemented a Dyte-powered video application. The feature-set included in this first release and future releases should help you provide a great continuing experience for your clients and identify pain points that need to be addressed. Supercharge your Dyte SDK deployment today with the new developer portal!


